Decoding Dice Combination Probabilities in Sic Bo for Informed Bet Placement
Noah Weber · Aug 8, 2026
Decoding Dice Combination Probabilities in Sic Bo for Informed Bet Placement
Players encounter Sic Bo as a dice game that relies on three standard six-sided dice, and understanding the underlying probabilities starts with recognizing that 216 total outcomes exist each time the dice settle; this fixed number forms the foundation for every bet calculation since each die shows one through six independently. Observers note that the game's structure allows wagers on single numbers, two-dice combinations, three-of-a-kind results, and point totals ranging from four to seventeen, while each category carries distinct mathematical frequencies derived from exhaustive enumeration of those 216 possibilities.
Core Mechanics and Outcome Enumeration
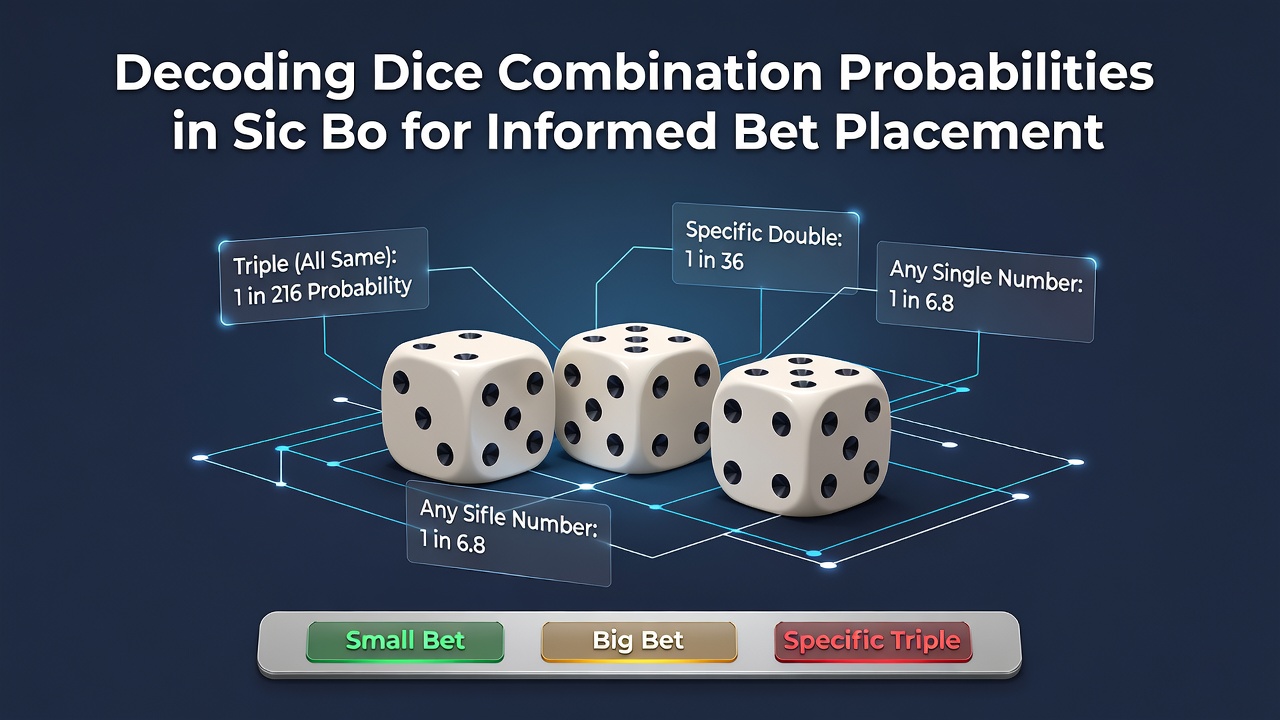
Research from probability studies confirms that every roll distributes outcomes evenly across the sample space, so the chance of any specific triplet such as 1-2-3 equals exactly 1 in 216; yet most wagers combine multiple triplets into broader categories, which raises their hit rates accordingly. Data indicates that small bets covering totals of four through ten, excluding triples, succeed in 48.61 percent of rolls because 105 favorable combinations out of 216 support this range, and the identical percentage applies symmetrically to big bets on eleven through seventeen. Those who've examined payout tables observe that casinos adjust returns to reflect these frequencies, typically offering even money on big and small while paying higher multiples on rarer events.
Single Number and Double Bets
Betting on a specific number appearing at least once produces a 42.13 percent success rate according to combinatorial counts, since 75 outcomes include that face at minimum; however the payout remains one to one because three matching dice pay separately under triple rules. Double bets, which require exactly two dice to match a chosen value while the third differs, occur in 7.41 percent of rolls because 16 combinations satisfy the condition for each pair type. Industry reports from the Nevada Gaming Control Board document these percentages across approved tables, and similar figures appear in regulatory filings from Australian state authorities that oversee electronic Sic Bo variants.
What's interesting emerges when players consider total bets, where the number four shows only three ways to appear while fifteen matches that same count, yet sixteen drops to six combinations and seventeen reaches only three; these skewed distributions explain why payouts scale from 50 to 1 down to 6 to 1 as the totals move toward the center. A study published through university mathematics departments calculated that the most probable total remains ten or eleven, each appearing in 27 combinations for a 12.5 percent rate, which aligns with the bell-curve shape of three-dice sums.

Triple and Specific Combination Wagers
Any specific three-of-a-kind carries a 0.46 percent probability because only one triplet matches the exact faces out of 216 possibilities, and casinos compensate with 150 to 1 or 180 to 1 returns depending on the venue. All-triples bets, which win on any matching set, improve the hit rate to 2.78 percent since six possible triples exist; this still qualifies as a low-frequency outcome that experienced analysts track through long-run simulations. Pair bets on two specific numbers appearing together occupy an intermediate tier at roughly 13.89 percent, calculated from 30 supporting outcomes per designated pair.
Those analyzing game data in August 2026 note continued refinement of electronic Sic Bo platforms that display real-time frequency counters, yet the underlying 216-outcome matrix remains unchanged regardless of digital presentation. Figures from the New Jersey Division of Gaming Enforcement reveal consistent house edges across these categories, with small and big bets carrying 2.78 percent margins while triple wagers exceed 30 percent, illustrating how probability directly informs the cost of each placement.
Applying Probabilities to Bet Selection
Analysts recommend structuring wagers around the higher-frequency categories such as big, small, or central totals because their occurrence rates exceed 12 percent and produce steadier bankroll movement over extended sessions; in contrast, low-probability triple bets serve occasional high-reward roles when tables offer elevated multipliers. Observers have documented that combining a big bet with a specific total wager can create layered exposure, since overlapping outcomes allow partial returns even when the primary target misses. Evidence from aggregated table records shows that players who track recent rolls sometimes adjust toward under-bet totals, although the independent nature of each throw keeps long-term frequencies fixed at their calculated values.
Academic papers on dice probability emphasize that variance increases with rarer bets, which means short-term deviations from expected rates appear more pronounced on triple placements than on big or small; this statistical property guides many placement patterns observed in regulated environments. Government reports from Canadian provincial gaming bodies further confirm that transparent probability disclosure reduces player confusion and supports more measured decision processes across Sic Bo tables.
Conclusion
Comprehensive mapping of the 216 possible dice outcomes provides the factual basis for every Sic Bo wager, and the resulting percentages for each betting category remain constant across physical and electronic formats. Data from multiple regulatory jurisdictions demonstrates that informed placement follows directly from these enumerated frequencies rather than from pattern recognition or external influences. Continued access to verified probability tables enables consistent evaluation of risk levels attached to different combination types, supporting structured participation grounded in mathematical distributions.