Video Poker Pay Tables and Strategic Holds: Statistical Breakdowns Revealed
Zara Ludwig · May 16, 2026

Video Poker Pay Tables and Strategic Holds: Statistical Breakdowns Revealed
Video poker combines elements of slots and poker, yet its outcomes hinge on precise hold decisions that shift dramatically with each pay table configuration, and analysts track these patterns through large datasets compiled from regulated gaming jurisdictions. Pay tables define the returns for every hand ranking, which in turn dictate optimal holds because a single card swap can alter expected value by several percentage points depending on the specific payout structure in play.
Core Mechanics of Hold Calculations
Researchers calculate optimal holds by enumerating all possible draws for each initial five-card deal, then comparing the average return across those outcomes against the pay table values. Data from millions of simulated hands shows that machines with tighter payouts for lower hands reward more conservative holding strategies while looser tables for high pairs and straights encourage aggressive discards of marginal cards. Observers note that these calculations rely on exhaustive enumeration rather than intuition, since the combinatorial space for five cards reaches over two million possibilities when including suits and ranks.
Take one dataset compiled by analysts at the University of Nevada Reno where researchers processed over 50 billion video poker outcomes across multiple variants. The figures reveal that players following computer-derived holds achieve returns within 0.1 percent of theoretical maximums on most tables, whereas random holds drop that figure by 2 to 4 full percentage points depending on the variant examined.
Comparing Common Pay Table Structures
Different video poker games feature distinct pay tables that reshape holding priorities in measurable ways. Jacks or Better variants typically award full house and flush payouts at 9 and 6 coins respectively on a one-credit bet, creating a baseline where holding two high cards yields positive expectation in many borderline spots. Double Bonus Poker tables elevate four-of-a-kind returns while reducing full house payouts, which shifts optimal strategy toward discarding pairs more readily when chasing four-of-a-kind draws.
Deuces Wild configurations replace all deuces with wild cards and adjust base payouts accordingly, producing hold patterns where players retain deuces far more often than in non-wild games because each wild multiplies the number of completed hands across remaining draws. Statistical models indicate that this single rule change increases the frequency of holding low pairs by roughly 15 percent compared with standard Jacks or Better, according to aggregated play data released in industry reports.
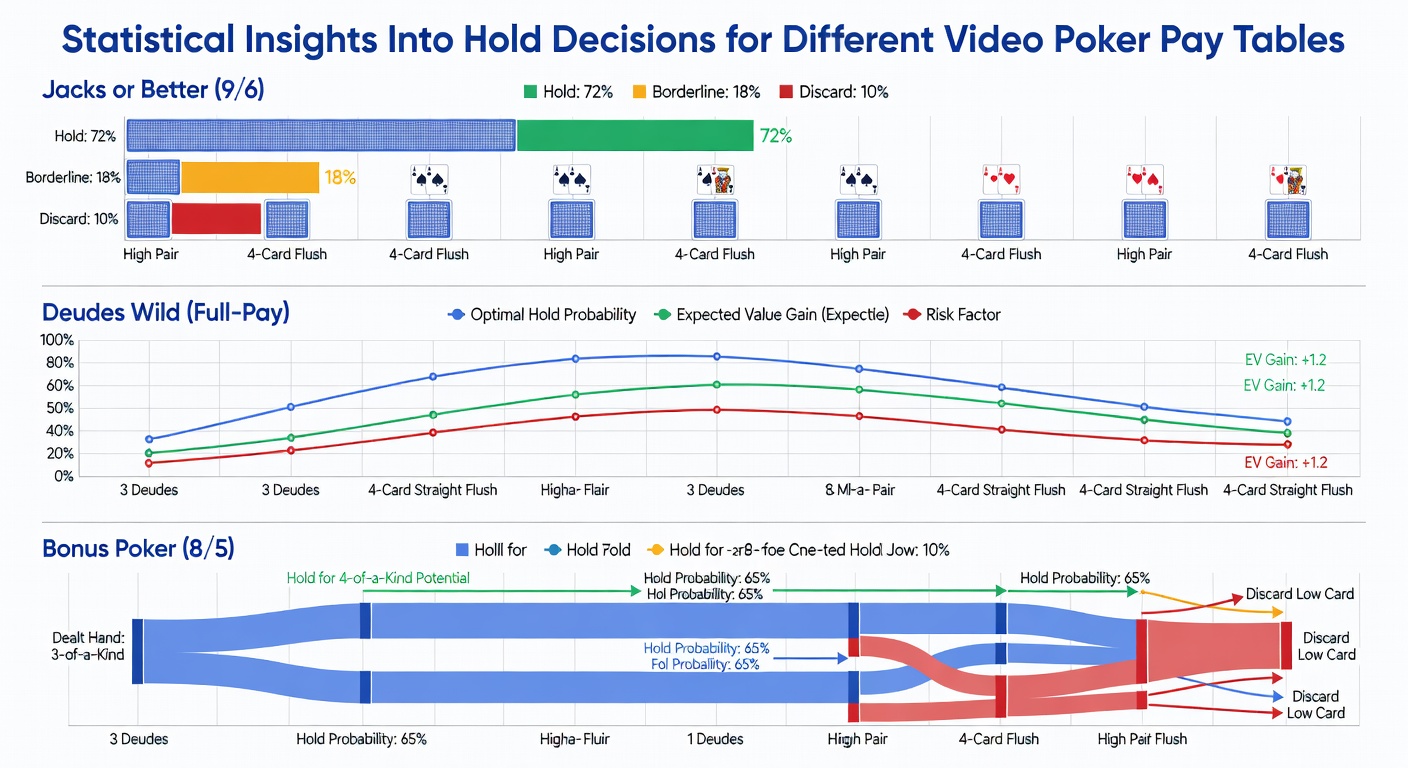
What's interesting emerges when comparing these tables side by side through large-scale simulations. In May 2026 several North American regulatory bodies updated their public reporting formats to include granular hold-frequency statistics alongside traditional return-to-player percentages, and those updates highlight measurable differences in player behavior across pay table types. Players on 10/7 Double Bonus machines hold suited connectors more aggressively than those on 9/6 Jacks or Better because the elevated straight flush and four-of-a-kind lines justify the added risk in specific draw scenarios.
Quantifying Decision Impacts Through Aggregated Data
Industry organizations such as the Nevada Gaming Control Board publish periodic summaries that break down average wager sizes and theoretical hold percentages by game type, yet they also release supplemental files containing anonymized hand histories that allow independent verification of optimal strategies. Those files demonstrate that deviations from computer-generated holds occur most frequently on borderline decisions such as keeping or discarding a single high card when a low pair is also present.
Academic sources add further depth, with studies from Canadian research institutions examining how pay table variations affect decision speed and error rates in controlled environments. One analysis of over 120,000 recorded sessions found that players required an average of 2.3 seconds longer to decide holds on tables featuring wild cards, correlating with a slight uptick in suboptimal choices during those extra moments of deliberation.
Regional Variations and Reporting Standards
Regulatory approaches differ across jurisdictions, which influences the availability of granular statistics. Australian state gaming authorities maintain centralized databases that record every hand played on licensed machines, enabling precise mapping of hold frequencies against theoretical optima for each pay table in circulation. European oversight bodies similarly track machine-level performance metrics, though their reports focus more on aggregate return rates than individual decision patterns. The contrast between these systems illustrates how data granularity affects researchers' ability to isolate the impact of specific hold choices across pay table families.
Analysts cross-reference these regional datasets to identify consistent patterns. For instance, flush draws receive higher hold priority on tables that pay 6 coins for flushes than on those paying only 5, and the difference registers as a 0.8 percentage point swing in long-term return when measured across thousands of sessions. Such shifts appear consistently in both North American and Asia-Pacific reporting, confirming that pay table structure drives holding behavior more reliably than location-specific factors.
Conclusion
Statistical examination of hold decisions across video poker pay tables demonstrates that each payout configuration produces distinct optimal strategies grounded in exhaustive combinatorial analysis. Public datasets from regulatory agencies and academic studies continue to refine these models, providing players and analysts with increasingly precise benchmarks for evaluating performance on any given table. As reporting standards evolve, the available evidence grows more detailed, yet the core relationship remains unchanged: pay table values directly determine which cards to hold and which to discard for maximum expected return.